Monitor Nginx Access Log In Cloudwatch


Last week we saw how we could Setup CloudWatch to push logs from our application to CloudWatch. Apart from the application logs, another type of logs that is worth looking into are the access logs from Nginx. Nginx being the entrypoint of the application, every traffic in and out goes through it and today we will see how we can leverage its access logs to monitor the response time of our application from CloudWatch.
Log Upstream Response Time
By default Nginx does not log the upstream response time. In order to print it, we can create a new log format which includes it and configure logs to be written into a file using that format. We can add our log configuration in a file called log_format.conf which we can place under /etc/nginx/conf.d/ and nginx will include the configuration under http directive by default.
We start first by defining a log_format directive:
1
2
3
4
5
log_format main '[$time_local] '
            '$remote_addr '
            '"$request" '
            '$status '
            '$upstream_response_time';
Then we define where the access log using the format we just defined main will be written:
1
access_log /var/log/nginx/myapp.access.log main;
So here is the full /etc/nginx/conf.d/log_format.conf file:
1
2
3
4
5
6
7
log_format main '[$time_local] '
            '$remote_addr '
            '"$request" '
            '$status '
            '$upstream_response_time';

access_log /var/log/nginx/myapp.access.log main;
Once we are done, we should now have access log printed with the upstream response time.
1
2
3
[02/Nov/2018:17:47:57 +0000] x.x.x.x "GET /myapp HTTP/1.1" 200 0.616
[02/Nov/2018:17:51:23 +0000] x.x.x.x "GET /myapp HTTP/1.1" 200 0.734
[02/Nov/2018:17:54:52 +0000] x.x.x.x "GET /myapp HTTP/1.1" 200 0.634
From the access log, we now have valuable information with the upstream response time allowing us to know how long our calls took.
Setup CloudWatch Agent
If you are not familiar with CloudWatch, refer to my previous blog post where I show how to setup CloudWatch to push application logs to CloudWatch.
We had the following config.json:
1
2
3
4
5
6
7
8
9
10
11
12
13
14
15
16
17
18
{
    "logs": {
        "logs_collected": {
            "files": {
                "collect_list": [
                    {
                        "file_path": "/var/log/myapp/*.json",
                        "log_group_name": "myapp/json",
                        "log_stream_name": "myapp",
                        "timezone": "UTC",
                        "timestamp_format": "%Y-%m-%dT%H:%M:%S"
                    }
                ]
            }
        },
        "log_stream_name": "default"
    }
}
This file was configuring log stream containing the logs from myapp. From there, we can add a new source file which will be pushed to a CloudWatch stream called access_log under a log group named myapp/ngin.
We do that by adding the logs in the collection_list:
1
2
3
4
5
6
7
8
9
10
11
12
13
14
15
16
17
18
19
20
21
22
23
24
{
    "logs": {
        "logs_collected": {
            "files": {
                "collect_list": [
                    {
                        "file_path": "/var/log/myapp/*.json",
                        "log_group_name": "myapp/json",
                        "log_stream_name": "myapp",
                        "timezone": "UTC",
                        "timestamp_format": "%Y-%m-%dT%H:%M:%S"
                    },
                    {
                        "file_path": "/var/log/nginx/myapp.*",
                        "log_group_name": "myapp/nginx",
                        "log_stream_name": "access_log",
                        "timezone": "UTC"
                    }
                ]
            }
        },
        "log_stream_name": "default"
    }
}
We make sure that the file_path is the path where we saved the access log file.
This will then push our access log to CloudWatch.
We then refrehs the agent:
1
sudo /opt/aws/amazon-cloudwatch-agent/bin/amazon-cloudwatch-agent-ctl -a fetch-config -m ec2 -c file:/opt/aws/amazon-cloudwatch-agent/etc/config.json -s
CloudWatch agent documentation
Setup Metrics Filter
Lastly, because our logs are of a defined format, we can use the metrics filter to create a metrics which will get all response_time for the GET /myapp
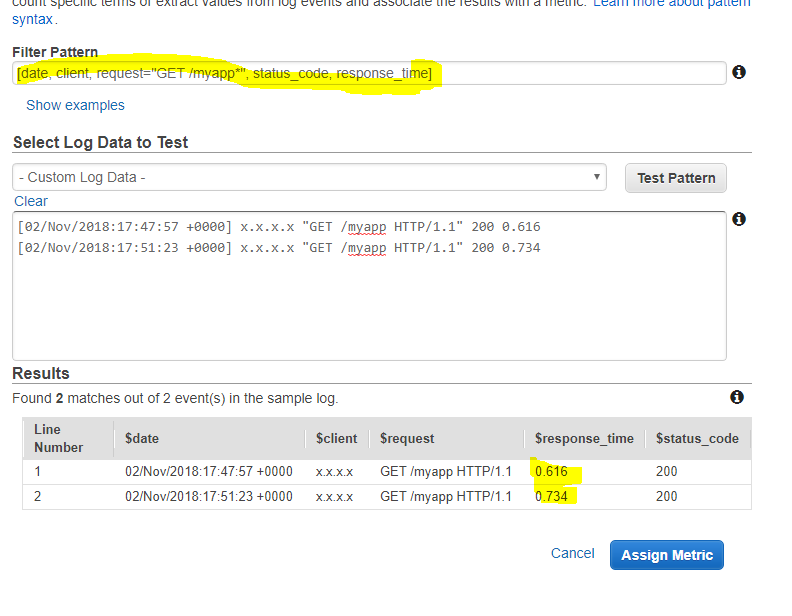
We go to CloudWatch, in the logs, select a log group then click on Create metric filter. In the file pattern, we use the Space-Delimited Log Events notation to match a text format:
1
[date, client, request="GET /myapp*", status_code, response_time]
This will filter all Get /myapp requests as we can see in the example:
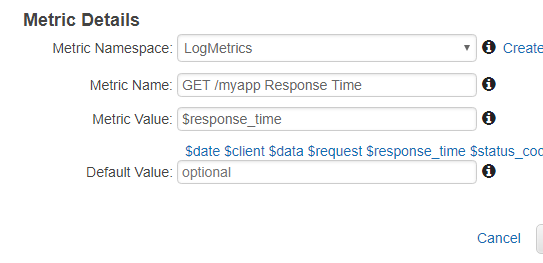
We then go next and set the metrics details by naming the metrics and selecting the value as $response_time.
Once created, we can now go to the metrics view and select it to explore the value that we receive under Log Metrics > Metrics with no dimensions > GET /myapp Response Time. From the metrics view, we can construct graphs by selecting multiple metrics or we can also add an arithmetic expression to compute a value out of multiple metrics. Once the graph created, we can then add it to a dashboard to monitor our application through different lenses on a single place.
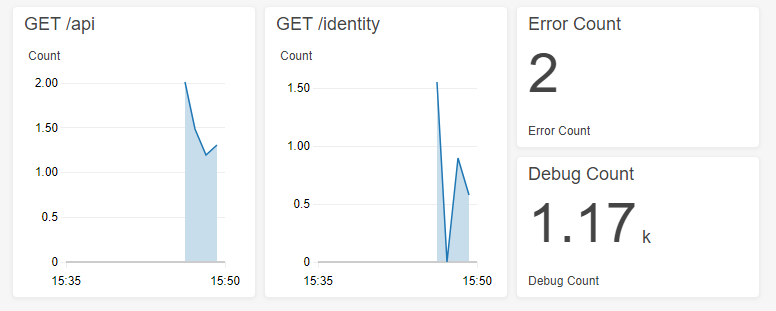
For example, we can monitor the response time of different endpoints on a dashboard and follow the error counts.
And that concludes this post on how to monitor upstream response time with Nginx on CloudWatch dashboard.
Conclusion
Today we saw how we could monitor upstream response time on our application using Nginx and plotting it on a CloudWatch dashboard. We started by looking at how to setup Nginx logs to provide upstream response time, then we moved to see how we could push Nginx logs to CloudWatch and lastly we looked into how to create a metric from the Nginx logs on CloudWatch to graph the upstream response time and add it to a dashboard which can then be used to monitor our application. Hope you liked this post, see you on the next one!