Prometheus With Aspnetcore


Jan 11th, 2019 - written by Kimserey with .
Prometheus is an open source monitering platform. It provides multiple functionalities to store, manipulate and monitor metrics from our applications. Today we will see how we can push metrics from an ASP NET Core application, and how to make sense of it.
Local Prometheus Setup
To setup Prometheus we download it directly from the official website, in Windows we can directly download the executable. Once downloaded we can simply run the executable.
1
2
3
4
5
6
7
8
9
$ prometheus.exe

level=info ts=2018-12-05T20:05:05.2715528Z caller=main.go:244 msg="Starting Prometheus" version="(version=2.5.0, branch=HEAD, revision=67dc912ac8b24f94a1fc478f352d25179c94ab9b)"
level=info ts=2018-12-05T20:05:05.2725529Z caller=main.go:245 build_context="(go=go1.11.1, user=root@578ab108d0b9, date=20181106-11:50:04)"
level=info ts=2018-12-05T20:05:05.2725529Z caller=main.go:246 host_details=(windows)
level=info ts=2018-12-05T20:05:05.2735525Z caller=main.go:247 fd_limits=N/A
level=info ts=2018-12-05T20:05:05.2735525Z caller=main.go:248 vm_limits=N/A
level=info ts=2018-12-05T20:05:05.2745512Z caller=main.go:562 msg="Starting TSDB ..."
level=info ts=2018-12-05T20:05:05.2745512Z caller=web.go:399 component=web msg="Start listening for connections" address=0.0.0.0:9090
Prometheus is now running properly and we should be able to access the UI from localhost:9090. For the moment the only metrics available are the metrics from the Prometheus instance itself. The way Prometheus gets metrics is via scrapping. It will scrap endpoints which are configured in the prometheus.yml at an interval specified and store those metrics. If we look into the files extracted, we should also have the prometheus.yml configuration with it. Because we will be monitoring metrics from our ASP NET Core application, we need to add it under the scrape_configs:
1
2
3
4
5
scrape_configs:
  - job_name: api
    metrics_path: /metrics
    static_configs:
    - targets: ['localhost:5000']
We added a job named api and specified the target being localhost:5000/metrics. Next we simply restart Prometheus and it will pick up the configuration and start scrapping localhost:5000/metrics for metrics every 15 seconds (default interval setup).
ASP NET Core Metrics
For Prometheus metrics in ASP NET core, we will be using prometheus-net. We start by installing it from NuGet, next we register it on the app builder:
1
app..UseMetricServer();
It serves the metrics on a default /metrics endpoint. We can now run the application and navigate to /metrics.
1
2
3
4
5
6
7
8
9
10
11
12
13
14
15
16
17
18
19
20
21
22
23
24
25
26
27
28
29
# HELP dotnet_totalmemory Total known allocated memory
# TYPE dotnet_totalmemory gauge
dotnet_totalmemory 7802936
# HELP process_windows_virtual_bytes Process virtual memory size
# TYPE process_windows_virtual_bytes gauge
process_windows_virtual_bytes 2217721794560
# HELP process_windows_processid Process ID
# TYPE process_windows_processid gauge
process_windows_processid 1000
# HELP api_status_code_count API Status Code count
# TYPE api_status_code_count counter
api_status_code_count{method="GET",path="/api/hello",status_code="200"} 1
# HELP process_windows_open_handles Number of open handles
# TYPE process_windows_open_handles gauge
process_windows_open_handles 504
# HELP process_start_time_seconds Start time of the process since unix epoch in seconds.
# TYPE process_start_time_seconds gauge
process_start_time_seconds 1544041587.04771
# HELP process_cpu_seconds_total Total user and system CPU time spent in seconds.
# TYPE process_cpu_seconds_total counter
process_cpu_seconds_total 1.359375
# HELP dotnet_collection_count_total GC collection count
# TYPE dotnet_collection_count_total counter
dotnet_collection_count_total{generation="0"} 0
dotnet_collection_count_total{generation="2"} 0
dotnet_collection_count_total{generation="1"} 0
# HELP process_windows_num_threads Total number of threads
# TYPE process_windows_num_threads gauge
process_windows_num_threads 25
When we go to metrics, we get the following text data as response. Those are the default Kestrel metrics setup by prometheus-net in a format understood by Prometheus. It starts with a HELP explaining what the metrics is and followed by the metrics type gauge|counter|histogram|summary and followed by the metrics format name{labels} value. We should now be able to access those metrics from the Prometheus UI localhost:9090. prometheus-net makes the task easier for us to push metrics in the proper format by providing static functions creating any type of metrics. In this post we will see how we can setup our application to push response time. Considering the following controller:
1
2
3
4
5
6
7
8
9
10
[ApiController]
[Route("api/hello")]
public class HelloController : ControllerBase
{
    [HttpGet]
    public ActionResult<string> Get()
    {
        return "Hello";
    }
}
We want to be able to measure its response time. To do that we use the Metrics.CreateHistogram(...) from prometheus-net.
1
2
3
4
5
6
7
8
9
10
11
12
13
14
15
16
17
18
19
20
21
22
23
24
25
26
27
28
29
public class ResponseTimeMiddleware
{
    private readonly RequestDelegate _next;

    public ResponseTimeMiddleware(RequestDelegate next)
    {
        _next = next;
    }

    public async Task InvokeAsync(HttpContext context, IMonitoringService service)
    {
        var sw = Stopwatch.StartNew();
        await _next(context);
        sw.Stop();

        var histogram =
            Metrics
                .CreateHistogram(
                    "api_response_time_seconds",
                    "API Response Time in seconds",
                    new[] { 0.02, 0.05, 0.1, 0.15, 0.2, 0.5, 0.8, 1 },
                    "method",
                    "path");

        histogram
            .WithLabels(context.Request.Method, context.Request.Path)
            .Observe(sw.Elapsed.TotalSeconds);
    }
}
We use a middleware to start a stopwatch before and stop it after the underlying mvc core middleware. We then create a histogram metrics specifying in order:
- the name of the metrics
api_response_time_seconds - a description
- the buckets for the histogram
- labels
methodandpathwhich will serve as further filters
1
2
3
app
  .UseMetricServer()
  .UseMiddleware<ResponseTimeMiddleware>();
We then save our response time in the histogram by calling .Observe(). Note that .WithLabels() must be called before observing the value. Once we run and navigate, we will now be pushing metrics to Prometheus and when we look at the UI localhost:9090, we should now see the metrics:
1
2
3
4
5
6
7
8
9
api_response_time_seconds_bucket{instance="localhost:5000",job="api",le="+Inf",method="GET",path="/api/hello"}	1
api_response_time_seconds_bucket{instance="localhost:5000",job="api",le="0.02",method="GET",path="/api/hello"}	0
api_response_time_seconds_bucket{instance="localhost:5000",job="api",le="0.05",method="GET",path="/api/hello"}	0
api_response_time_seconds_bucket{instance="localhost:5000",job="api",le="0.1",method="GET",path="/api/hello"}	0
api_response_time_seconds_bucket{instance="localhost:5000",job="api",le="0.15",method="GET",path="/api/hello"}	0
api_response_time_seconds_bucket{instance="localhost:5000",job="api",le="0.2",method="GET",path="/api/hello"}	0
api_response_time_seconds_bucket{instance="localhost:5000",job="api",le="0.5",method="GET",path="/api/hello"}	1
api_response_time_seconds_bucket{instance="localhost:5000",job="api",le="0.8",method="GET",path="/api/hello"}	1
api_response_time_seconds_bucket{instance="localhost:5000",job="api",le="1",method="GET",path="/api/hello"}	1
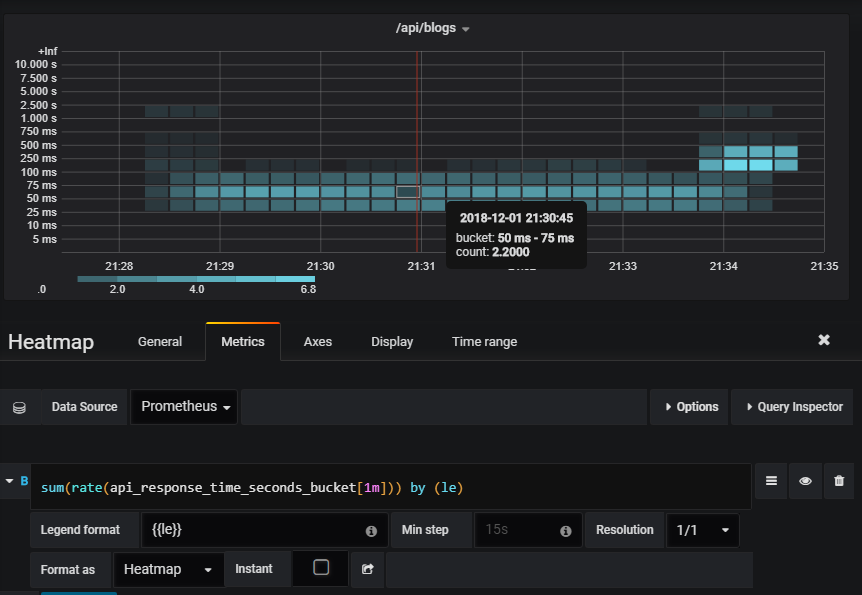
On the query input of the UI, we can filter by metrics name and label, for example api_response_time_seconds_bucket{le="0.05"}. We can also filter using regex on label with =~ for example api_response_time_seconds_bucket{le=~"(0.05|0.1)"}. It works fine but the problem is that we are handling all requests and saving response time for any requests sent to the server whether valid or not with the consequence of creating wasteful buckets which will slow down every scrap request as we would sending useless metrics.
One of the usecases of histogram is plotting heatmap on Graphana.
Attribute Based Monitoring
Instead of saving response time of any requests, what we want to have is a way to indicate to the application which endpoints should be monitored. Here we only want to monitor api/hello, a nice way is to provide an attribute [Monitor] which can decorate the controller route:
1
2
3
4
5
6
7
8
9
10
11
[ApiController]
[Route("api/hello")]
public class HelloController : ControllerBase
{
    [HttpGet]
    [Monitor]
    public ActionResult<string> Get()
    {
        return "Hello";
    }
}
To implement that, we start first by creating a MonitorAttribute and a IMonitoringService which will be used to decide whether a request should be monitored:
1
2
3
4
5
6
public class MonitorAttribute : Attribute { }

public interface IMonitoringService
{
    bool Monitor(string httpMethod, PathString path);
}
We then implement the monitoring service where we decide whether to monitor the endpoint by using the IApiDescriptionGroupCollectionProvider Mvc service:
1
2
3
4
5
6
7
8
9
10
11
12
13
14
15
16
17
18
19
20
21
22
23
24
25
26
27
28
29
30
public class MonitoringService: IMonitoringService
{
    private (string httpMethod, TemplateMatcher matcher)[] _matchers;

    public MonitoringService(IApiDescriptionGroupCollectionProvider provider)
    {
        _matchers =
            provider
                .ApiDescriptionGroups
                .Items
                .SelectMany(group => group.Items)
                .Where(x =>
                    x.ActionDescriptor is ControllerActionDescriptor
                    && ((ControllerActionDescriptor)x.ActionDescriptor).MethodInfo.CustomAttributes.Any(attr => attr.AttributeType == typeof(MonitorAttribute)))
                .Select(desc => {
                    var routeTemplate = TemplateParser.Parse(desc.RelativePath);
                    var routeValues = new RouteValueDictionary (routeTemplate
                        .Parameters
                        .ToDictionary(x => x.Name, y => y.DefaultValue));
                    var matcher = new TemplateMatcher(routeTemplate, routeValues);
                    return (desc.HttpMethod, matcher);
                })
                .ToArray();
    }

    public bool Monitor(string httpMethod, PathString path)
    {
        return _matchers.Any(m => m.httpMethod == httpMethod && m.matcher.TryMatch(path, new RouteValueDictionary()));
    }
}
We start first by enumarating all controllers with a method decorated by MonitorAttribute.
1
2
3
.Where(x =>
    x.ActionDescriptor is ControllerActionDescriptor
    && ((ControllerActionDescriptor)x.ActionDescriptor).MethodInfo.CustomAttributes.Any(attr => attr.AttributeType == typeof(MonitorAttribute)))
Then we create a route matcher for each route to monitor and save the HTTP method used in a tuple.
1
2
3
4
5
6
7
8
.Select(desc => {
    var routeTemplate = TemplateParser.Parse(desc.RelativePath);
    var routeValues = new RouteValueDictionary (routeTemplate
        .Parameters
        .ToDictionary(x => x.Name, y => y.DefaultValue));
    var matcher = new TemplateMatcher(routeTemplate, routeValues);
    return (desc.HttpMethod, matcher);
})
Lastly we use that tuple array of (http method, route matchers) initialised in the constructor to decide whether we should monitor the endpoint:
1
2
3
4
public bool Monitor(string httpMethod, PathString path)
{
    return _matchers.Any(m => m.httpMethod == httpMethod && m.matcher.TryMatch(path, new RouteValueDictionary()));
}
We now have a service which provide a function to decide to monitor or not. We can use it in our middleware previously created:
1
2
3
4
5
6
7
8
9
10
11
12
13
14
15
16
17
18
19
20
21
22
23
24
25
26
27
28
29
30
31
32
33
34
35
36
37
public class ResponseTimeMiddleware
{
    private readonly RequestDelegate _next;

    public ResponseTimeMiddleware(RequestDelegate next)
    {
        _next = next;
    }

    public async Task InvokeAsync(HttpContext context, IMonitoringService service, ICollectorRegistry registry)
    {
        if (service.Monitor(context.Request.Method, context.Request.Path))
        {
            var sw = Stopwatch.StartNew();
            await _next(context);
            sw.Stop();

            var histogram =
                Metrics
                    .WithCustomRegistry(registry)
                    .CreateHistogram(
                        "api_response_time_seconds",
                        "API Response Time in seconds",
                        new[] { 0.02, 0.05, 0.1, 0.15, 0.2, 0.5, 0.8, 1 },
                        "method",
                        "path");

            histogram
                .WithLabels(context.Request.Method, context.Request.Path)
                .Observe(sw.Elapsed.TotalSeconds);
        }
        else
        {
            await _next(context);
        }
    }
}
To ease the process of registering the service we provide extensions on IServiceCollection and IApplicationBuilder:
1
2
3
4
5
6
7
8
9
10
11
12
13
14
public static class MonitoringExtensions
{
    public static IServiceCollection AddMonitoring(this IServiceCollection services)
    {
        return services.AddSingleton<IMonitoringService, MonitoringService>();
    }

    public static IApplicationBuilder UseMonitoring(this IApplicationBuilder builder)
    {
        return builder
            .UseMetricServer()
            .UseMiddleware<ResponseTimeMiddleware>();
    }
}
We can then use the extensions directly in the Startup.cs:
1
2
3
4
5
6
7
8
9
public void ConfigureServices(IServiceCollection services)
{
  services.AddMonitoring();
}

public void Configure(IApplicationBuilder app, IHostingEnvironment env)
{
  app.UseMonitoring();
}
And that concludes today’s post, we now have a way to monitor endpoints by decorating routes with a Monitor attribute on ASP NET Core Mvc controllers.
Conclusion
Today we saw how to setup Prometheus locally, we then moved on to see how we could use prometheus-net to create histograms and save response time from our ASP NET Core application. Lastly we saw that monitoring anything and everything is not a good idea as most of it will just be none sense therefore we implemented an attribute which would allow us to specify which endpoints to monitor. Hope you liked this post, see you on the next one!