Uml Diagrams With Plantuml

In my work I draw diagrams almost every day. Whether it is to convey an idea to someone or to pindown an idea that I have in my head or simply to think about a solution for a problem.
Diagrams are useful as they are cheap, quick scribble on paper and we are done but everyone know that drawing is not an easy task and therefore even drawing diagrams is hard. You need a sense of aesthetics to use different shapes, place elements in a way that makes sense and use different ways of linking shapes so that the diagram doesn’t get convoluted, failing any of those steps will discourage your audience from even trying to understand what your diagram represents.
That’s where PlantUML comes in, or puml for short. PlantUML allows us to create diagrams from text script. In today’s post, we will learn how to build diagrams with PlantUML and look into different sort of diagrams that are often used.
This post is about general concepts of diagrams, not specific to UML.
Introduction to PlantUML
PlantUML is a tool which allows us to draw diagram from a text based domain specific language.
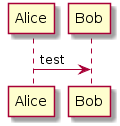
1
2
3
@startuml
Alice -> Bob: test
@enduml
To test the command and generate diagram, we can use the online editor and refer to the online documentation.
This will produce a sequence diagram composed of two participants, Alice and Bob. the arrow -> draws an arrow from Alice to Bob and annotates it with the message test.
To represent more interactions with more parties, we can add more arrows in the order we want to get them drawn, top to bottom.
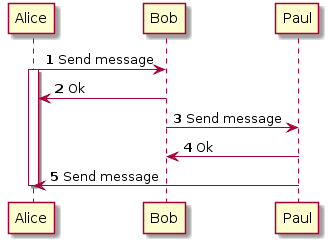
1
2
3
4
5
6
7
8
9
10
11
@startuml
autonumber
Alice -> Bob      : Send message
Alice <- Bob      : Ok
Bob -> Paul       : Send message
Bob <- Paul       : Ok

... After process ...

Paul -> Alice     : Send message
@enduml
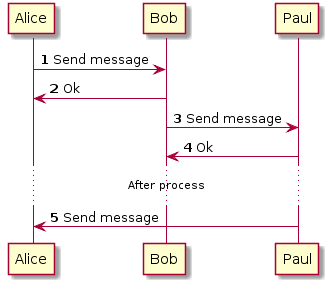
What we are seeing here is a sequence diagram, a 2D diagram with participants in horizontal axis and time in vertical axis. The request from 1 to 4 are in order from top to bottom. We will see in more details later how a sequence diagram can be represented, and what options PlantUML provides.
Apart from sequence diagrams, PlantUML also allows us to generate component diagrams. To do so, we can use the bracket notation, indicating the participants aren’t actors but components.
1
2
3
4
5
6
7
8
9
10
11
12
13
@startuml
cloud {
  [Service]

  database {
    [DB]
  }
}

[Browser] .> HTTP
HTTP - [Service]
[Service] .> [DB]
@enduml
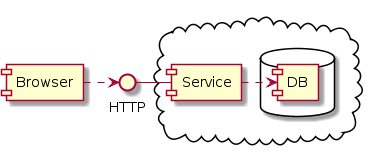
Even though the notation of relationship is similar, there are difference in the syntax and it is important to realise that diagrams notations aren’t compatible, can’t be mixed, and should not be mixed. This is more related to UML where even the arrow direction has a different meaning. For example in the sequence diagram, an arrow indicates an interaction from A to B while in a component diagram, an arrow will indicate a dependency on a service, in the case of A pointing to B, a dependency from A on service B.
Similarly, a different syntax is used for use case diagram, state diagram and activity diagram which we will see next.
Sequence Diagram
Starting from the sequence diagram that we saw earlier.
1
2
3
4
5
6
7
8
9
10
11
@startuml
autonumber
Alice -> Bob      : Send message
Alice <- Bob      : Ok
Bob -> Paul       : Send message
Bob <- Paul       : Ok

... After process ...

Paul -> Alice     : Send message
@enduml
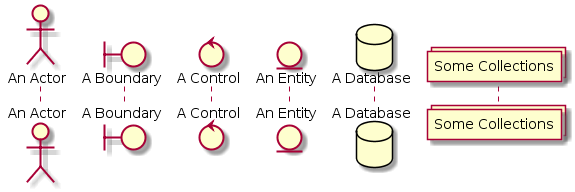
Each participant can be declared with a different shape, to represent UML patterns like a Robustness diagram with actor, boundary, entity and control.
1
2
3
4
5
6
7
8
@startuml
actor "An Actor"
boundary "A Boundary"
control "A Control"
entity "An Entity"
database "A Database"
collections "Some Collections"
@enduml
Activation in sequence diagram denotes the length of a process within the lifeline of a participant. The following example showcase how to use activation:
1
2
3
4
5
6
7
8
9
10
11
12
@startuml
autonumber
Alice -> Bob      : Send message
activate Alice

Alice <- Bob      : Ok
Bob -> Paul       : Send message
Bob <- Paul       : Ok

Paul -> Alice     : Send message
deactivate Alice
@enduml
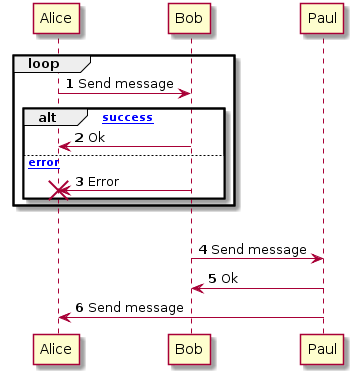
Another important feature of sequence diagram is Interaction which groups a piece of the diagram with a particular meaning. PlantUML supports the following:
- alt/else, to showcase alternative with else clauses,
- opt, to showcase options where the sequence is executed depending on the condition,
- loop, to showcase a iteration,
- break, to showcase a breaking clause within a loop,
- par, to showcase parallel execution of multiple fragment of the diagram,
- critical, to showcase a critical region where parallel execution is forbidden,
- group, a generic grouping.
1
2
3
4
5
6
7
8
9
10
11
12
13
14
15
16
17
18
19
@startuml
autonumber

loop
  Alice -> Bob      : Send message

  alt [success]
    Alice <- Bob    : Ok
  else [error]
    Alice <- Bob    : Error
    destroy Alice
  end
end
|||
Bob -> Paul       : Send message
Bob <- Paul       : Ok

Paul -> Alice     : Send message
@enduml
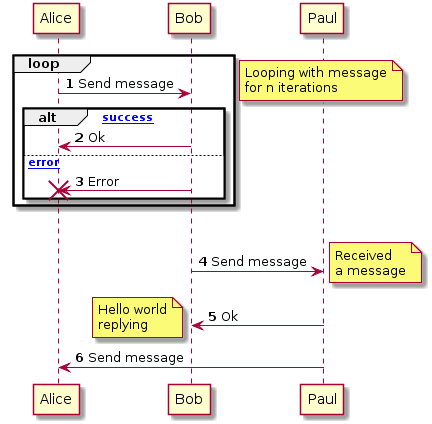
Apart from text describing interactions, we can also place notes throughout the diagram with note left or note right.
1
2
3
4
5
6
7
8
9
10
11
12
13
14
15
16
17
18
19
20
21
22
23
24
25
26
27
28
29
30
31
32
@startuml
autonumber


loop
  Alice -> Bob      : Send message

  alt [success]
    Alice <- Bob    : Ok
  else [error]
    Alice <- Bob    : Error
    destroy Alice
  end
end
note right
  Looping with message
  for n iterations
end note
|||
Bob -> Paul       : Send message
note right
  Received
  a message
end note
Bob <- Paul       : Ok
note left
  Hello world
  replying
end note

Paul -> Alice     : Send message
@enduml
Lastly in order to format our sequence diagram, we can make use of spacing, dividers and expression of delay.
1
2
3
4
5
6
7
8
9
10
11
12
13
14
15
16
17
18
19
20
21
22
23
24
25
26
27
28
29
30
31
32
33
34
35
36
@startuml
autonumber


loop
  Alice -> Bob      : Send message
  |||
  alt [success]
    Alice <- Bob    : Ok
  else [error]
    Alice <- Bob    : Error
    destroy Alice
  end
end
note right
  Looping with message
  for n iterations
end note

... After 15 minutes ...

Bob -> Paul       : Send message
note right
  Received
  a message
end note
Bob <- Paul       : Ok
note left
  Hello world
  replying
end note

== Reply ==

Paul -> Alice     : Send message
@enduml
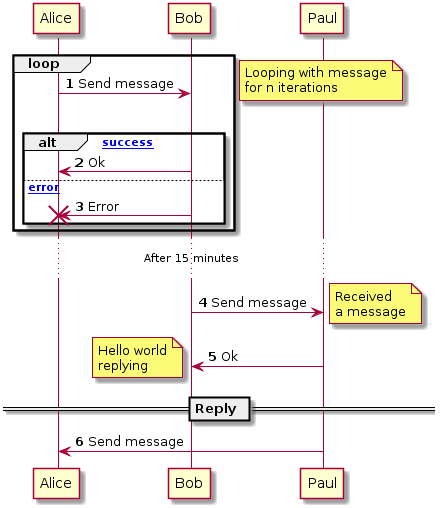
Delay is expressed with ... [message] ..., spacing is added with ||| and a divider can be added with == [message] ==.
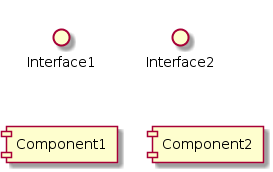
Component Diagram
A component diagram shows how components are related between each other. PlantUML provides a way to display both components and interfaces by using the notation [] for components, and () for interfaces.
1
2
3
4
5
6
@startuml
() Interface1
() Interface2
[Component1]
[Component2]
@enduml
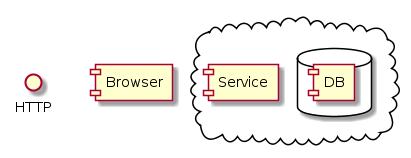
It also allows us define groups providing different visualization:
- package
- node
- folder
- frame
- cloud
- database
1
2
3
4
5
6
7
8
9
10
11
12
@startuml
() HTTP
[Browser]

cloud {
  [Service]

  database {
    [DB]
  }
}
@enduml
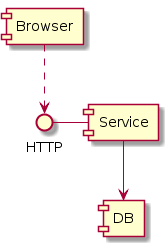
Lastly just like sequence diagram, we can connect components together or with interfaces with arrows. A single dash indicates an horizontal arrow, double a vertical, and triple will try to make a longer connection when drawing. Dots are used to indicate dashed arrows.
1
2
3
4
5
@startuml
[Browser] ..> HTTP
HTTP - [Service]
[Service] --> [DB]
@enduml
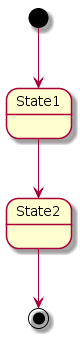
State Diagram
Another interesting diagram which can be generated from PlantUML is a state diagram. PlantUML knows that the diagram is a state diagram if it finds an initial state.
[*] is the initial/final state. And arrow departing from [*] would identify the initial state while and arrow pointing to [*] would identify the final state.
1
2
3
4
5
6
7
@startuml

[*] --> State1
State1 --> State2
State2 --> [*]

@enduml
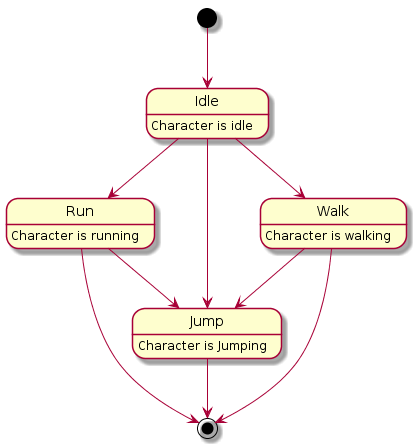
While defining state, a description can be provided for the state:
1
2
3
4
5
6
7
8
9
10
11
12
13
14
15
16
17
18
19
@startuml

Idle : Character is idle
Run  : Character is running
Walk : Character is walking
Jump : Character is Jumping

[*] --> Idle
Idle --> Walk
Idle --> Run
Idle --> Jump
Walk --> Jump
Run --> Jump

Walk --> [*]
Run --> [*]
Jump --> [*]

@enduml
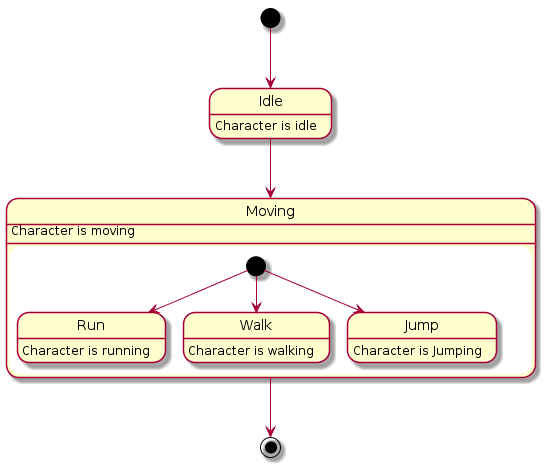
State can also be grouped:
1
2
3
4
5
6
7
8
9
10
11
12
13
14
15
16
17
18
19
20
21
@startuml

Idle : Character is idle

state Moving {
  Run  : Character is running
  Walk : Character is walking
  Jump : Character is Jumping

  [*] --> Run
  [*] --> Walk
  [*] --> Jump
}

Moving : Character is moving

[*] --> Idle
Idle --> Moving
Moving --> [*]

@enduml
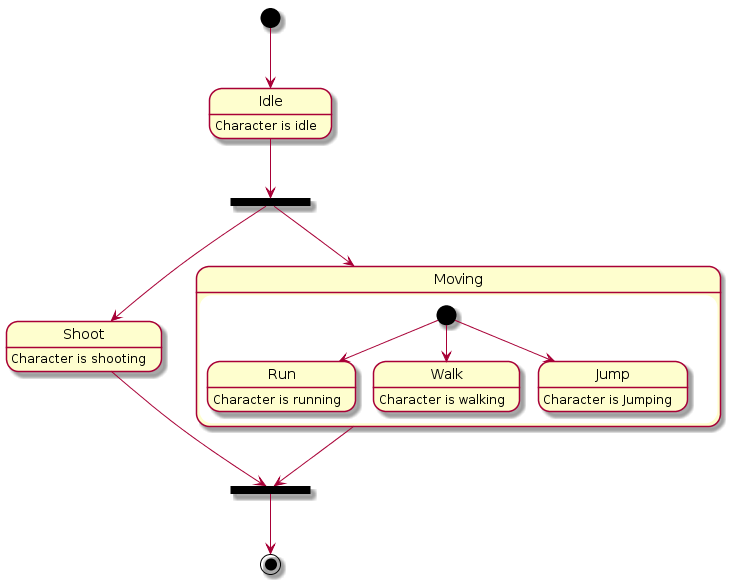
Lastly concurrent state can be represented with a fork:
1
2
3
4
5
6
7
8
9
10
11
12
13
14
15
16
17
18
19
20
21
22
23
24
25
26
27
28
@startuml

Idle  : Character is idle
Shoot : Character is shooting

state Moving {
  Run  : Character is running
  Walk : Character is walking
  Jump : Character is Jumping

  [*] --> Run
  [*] --> Walk
  [*] --> Jump
}

[*] --> Idle

state fork_state <<fork>>
Idle --> fork_state
fork_state --> Moving
fork_state --> Shoot

state join_state <<join>>
Moving --> join_state
Shoot --> join_state
join_state --> [*]

@enduml
Activity Diagram
For activity diagram, special keywords are used to start, stop and end are used to specify the beginning, a stopping point and an ending point in the activity diagram.
1
2
3
4
5
6
7
8
9
10
11
12
13
14
15
16
17
18
19
@startuml
start

:A;
:B;

if (A = B) then (true)
  :C;
elseif (A > B) then (true)
  :D;
  end
else
  end
endif

:E;

stop
@enduml
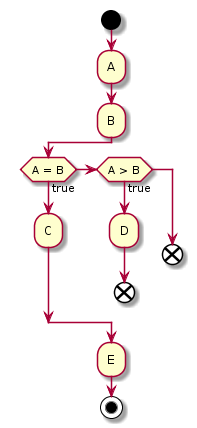
An activity is specified like :[my activity];. And a conditional logic is represented with
1
2
3
4
5
6
7
if ([description of the condition]) then ([arrow text on true condition])
  [activities]
elseif ([description of a secondary condition])
  [activities]
else ([arrow text on else condition])
  [activities]
endif
An activity diagram might describe the process of data where repeated activities are often in play. To do that we can represent a repeat loop with repeat:
1
2
3
4
5
6
7
8
9
10
11
12
@startuml Uppercase all words in sentence
start

repeat
  :take next word;
  :capitalize word;
repeat while (more word?) is (yes)
->no;
:concat all words;

stop
@enduml
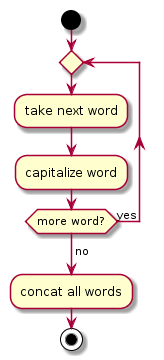
->no; annotates the arrow after the repeat loop. Any ->{label}; will annotate the arrow linking the activity before it and the next activity.
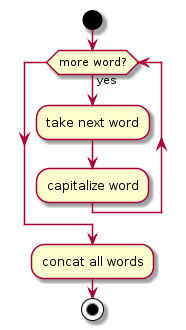
Similarly a while loop can be achieved with while:
1
2
3
4
5
6
7
8
9
10
11
12
@startuml Uppercase all words in sentence
start

while (more word?) is (yes)
  :take next word;
  :capitalize word;
endwhile

:concat all words;

stop
@enduml
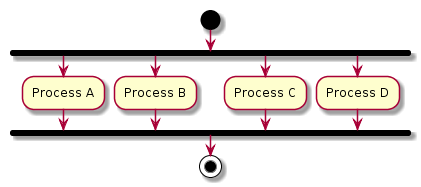
Parallel processing can be achieve with fork just like state diagram:
1
2
3
4
5
6
7
8
9
10
11
12
13
14
15
@startuml
start

fork
	:Process A;
  fork again
	:Process B;
   fork again
	:Process C;
  fork again
	:Process D;
end fork

stop
@enduml
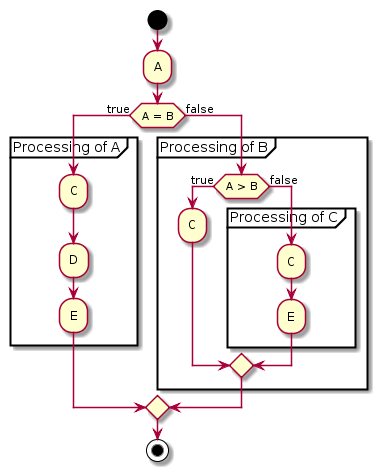
Activity diagrams can become very complex with a lot of activities and involving a lot of control flows. To deal with that we can group piece of the diagram in meaningful containers:
1
2
3
4
5
6
7
8
9
10
11
12
13
14
15
16
17
18
19
20
21
22
23
24
25
26
@startuml
start

:A;

if (A = B) then (true)
  partition "Processing of A" {
    :C;
    :D;
    :E;
  }
else (false)
  partition "Processing of B" {
    if (A > B) then (true)
      :C;
    else (false)
      partition "Processing of C" {
        :C;
        :E;
      }
    endif
  }
endif

stop
@enduml
And lastly we can also use connectors to split a diagram in multiple parts:
1
2
3
4
5
6
7
8
9
10
11
12
13
@startuml
start

:A;

if (A = B) then (true)
  (A)
else (false)
  (B)
endif
detach

@enduml
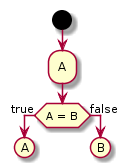
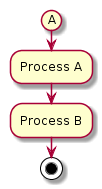
Detach is used to Where (A) and (B) are defined in other diagrams:
1
2
3
4
5
6
7
8
@startuml

(A)
:Process A;
:Process B;
stop

@enduml
And that concludes today’s post.
Conclusion
Today we looked into PlantUML and how it allows us to generate UML diagram from a simple DSL. We started by an introduction of PlantUML with its syntax and how it is able to know which diagram we are intending to draw. Then we moved on to see specific diagrams that are widely used in Software engineering, sequence diagram, component diagram, state and activity diagram. On top of those diagram, PlantUML also provides more interesting diagrams like the Timing diagram, Object diagrams and Use case diagram which I encourage you to look at as well! From this post I hope you could see how amazing is PlantUML, see you on the next one!