Xamarin Android Line Chart With Custom Renderer Canvas Api Part2


Last week we saw how we could use custom renderers with boxview to draw via the canvas api https://kimsereyblog.blogspot.co.uk/2016/10/build-your-own-line-chart-for.html. Today I will go through the steps to draw a line chart supporting markers. The line chart is very simple and has only one objective, give a rough indication of the current trend of the data displayed.

In order to draw the chart, we will divide the chart in four layer which we will draw one by one. Therefore this post will be composed by the three layers.
- Draw background and bands
- Draw axis and labels
- Draw lines and markers
1. Draw background and bands
We can see the canvas as a painting canvas. When we draw something and then draw something on top of that, the last thing drawn will hide the previous one - just like as if you are painting something on top of something else. Therefore the first thing we need to draw is the background.
1
2
3
// Draws background
paint.Color = Color.ParseColor("#2CBCEB");
canvas.DrawRect(new Rect(0, 0, this.Width, this.Height), paint);
this.Width and this.Height return respectively the view width and height.
Next we draw the bands.
In order to get the bands, we first need to know the boundaries of the graph. So I defined a class called PlotBoundaries:
1
2
3
4
5
6
7
class PlotBoundaries
{
    public float Left { get; set; }
    public float Right { get; set; }
    public float Top { get; set; }
    public float Bottom { get; set; }
}
Left, Right, Top and Bottom represent the X axis start, X axis end, Y axis start and Y axis end of the chart.
It will be used to place the chart in the view.
Also every lines, axis, labels and markers will be drawn using the boundaries as reference.
As it is easier to understand with a picture here is a picture of the empty plot:
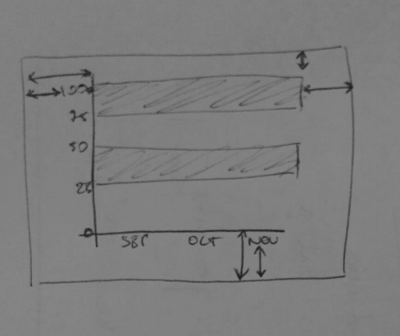
I have all my padding saved into an options object.
I have shown how you can access properties from the Xamarin.Forms view in my previous blog post - https://kimsereyblog.blogspot.co.uk/2016/10/build-your-own-line-chart-for.html,
that’s where I get the options from, if you want to see the full code please refer to my github (https://github.com/Kimserey/GraphTest.Droid2/blob/master/Droid/GraphViewRenderer.cs)[https://github.com/Kimserey/GraphTest.Droid2/blob/master/Droid/GraphViewRenderer.cs].
Left will be the padding left plus the text size and plus some small offset for the text to not be right next to the axis.
1
Left = options.Padding.Left * density + paint.MeasureText(ceilingValue.ToString()) + yAxisLabelOffset
Right will be the width minus the right padding.
1
Right = this.Width - options.Padding.Right * density
Top will be the top padding.
1
Top = options.Padding.Top * density,
And lastly Bottom will be the height minus bottom padding and minus the paint text size and minus a small offset again.
1
Bottom = this.Height - options.Padding.Bottom * density - paint.TextSize - xAxisLabelOffset
So the full code then becomes:
1
2
3
4
5
6
7
var plotBoundaries = new PlotBoundaries
{
    Left = options.Padding.Left * density + paint.MeasureText(ceilingValue.ToString()) + yAxisLabelOffset,
    Right = this.Width - options.Padding.Right * density,
    Top = options.Padding.Top * density,
    Bottom = this.Height - options.Padding.Bottom * density - paint.TextSize - xAxisLabelOffset
};
Using the boundaries we can also deduce the width and height of the plot:
1
2
var plotWidth = plotBoundaries.Right - plotBoundaries.Left;
var plotHeight = plotBoundaries.Bottom - plotBoundaries.Top;
Now that we have the boundaries, we need more information about the vertical sections. Therefore I created a section class:
1
2
3
4
5
6
class Section
{
    public int Count { get; set; }
    public float Width { get; set; }
    public float Max { get; set; }
}
Count is the number of section displayed on the graph, Width is the width of a section and Max is the overall maximum value of the Y axis.
1
2
3
4
5
var verticalSection = new Section
{
    Width = plotWidth / items.Count(),
    Count = items.Count()
};
There are as many vertical section as there are items and the width of each section is just the plotWidth divided by the number of items.
1
2
3
4
5
6
7
8
9
var sectionCount = 4;
var ceilingValue = Math.Ceiling(items.Max(i => i.Y) / 50.0) * 50.0;

var horizontalSection = new Section
{
    Max = (float)ceilingValue,
    Count = sectionCount,
    Width = plotHeight / sectionCount
};
In order to have a graph that renders nicely on a defined number of sections, the maximum value must be calculated by rounding up to the closest 50. I have set the number of section to 4 as I know that for any type of view in my usage, 4 sections is the nicest display.
Using that we can now draw the horizontal bands:
1
2
3
4
5
6
7
8
9
10
11
12
13
14
// Draws horizontal bands
paint.Reset();
paint.Color = bandsColor;
for (int i = horizontalSection.Count - 1; i >= 0; i = i - 2)
{
    var y = plotBoundaries.Bottom - horizontalSection.Width * i;

    canvas.DrawRect(
        left: plotBoundaries.Left,
        top: y - horizontalSection.Width,
        right: plotBoundaries.Right,
        bottom: y,
        paint: paint);
}
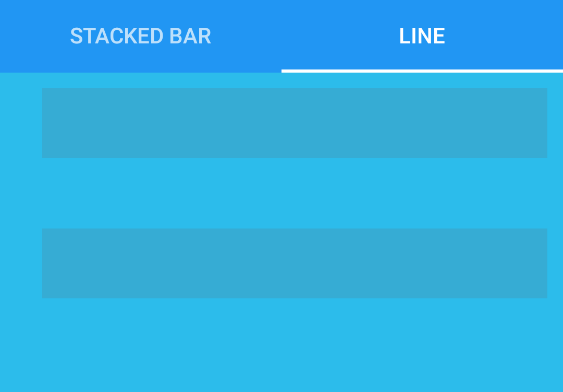
Woohoo nice! That looks like something at least. We can already imagine our chart on top of that drawing!
Let’s move to the next piece to draw the axis and labels.
2. Draw axis and labels
Let’s start first by drawing the axis. It’s pretty easy since we have the boundaries, for example the Y axis just extends from top to bottom and I let you guess how X axis is defined.
1
2
3
4
5
6
7
8
9
10
11
12
13
14
15
16
// Draws X and Y axis lines
paint.Reset();
paint.StrokeWidth = axisStrokeWidth;
paint.Color = lineColor;
canvas.DrawLine(
    plotBoundaries.Left,
    plotBoundaries.Bottom,
    plotBoundaries.Right,
    plotBoundaries.Bottom,
    paint);
canvas.DrawLine(
    plotBoundaries.Left,
    plotBoundaries.Top,
    plotBoundaries.Left,
    plotBoundaries.Bottom,
    paint);
Next the labels, in order to place the labels correctly, we need to go through each of the items and calculate the pixel y value.
By pixel value I mean the value which will be used to be displayed on screen.
In order to find the pixel value we use a formula:
1
var pixelValue = realValue * plotHeight / verticalMaxValue
Where does this formula comes from? Well it comes from what we learn in college - the cross formula - or something like that… I guess…
Anyway this formula respect the proportions. It basically says since I know that plotHeight (in px) ~= verticalMaxValue (in real units), how much pixel does the realValue (in real units) takes?
And the responce is you take the realValue times it by the plotHeight and divide by the verticalMaxValue.
We also want to know the x pixel position.
We calculate that with the following formula:
1
var x = verticalSection.Width * (index + 0.5f);
Since every x labels will be placed in the middle of the section, we half the section * 0.5f and since the index starts at 0, it is always index + 0.5f.
Alright knowing that, we can iterate over all the items and construct a points list which will contain all the value normalized.
1
2
3
4
5
6
7
8
9
10
11
12
13
14
15
//// Calculates all the data coordinates
var points = new List<Tuple<float, float, string, double>>();
foreach (var l in items.Select((l, index) => Tuple.Create(l.X, l.Y, index)))
{
    var x = verticalSection.Width * (l.Item3 + 0.5f);
    var y = (float)l.Item2 * plotHeight / horizontalSection.Max;

    points.Add(
        Tuple.Create(
            x + plotBoundaries.Left,
            plotBoundaries.Bottom - y,
            l.Item1,
            l.Item2
        ));
}
Nice now let’s draw X axis and Y axis.
1
2
3
4
5
6
7
8
9
10
11
12
13
14
15
16
17
18
19
20
21
22
23
24
25
26
27
28
29
30
31
32
33
34
// Draws X axis labels
paint.Reset();
paint.TextAlign = Paint.Align.Center;
paint.TextSize = labelTextSize;
foreach (var l in items.Select((GraphData l, int index) => Tuple.Create(l.X, index)))
{
    var x = verticalSection.Width * (l.Item2 + 0.5f) + plotBoundaries.Left;

    paint.Color = lineColor;

    canvas.DrawText(
        text: l.Item1,
        x: x,
        y: plotBoundaries.Bottom + paint.TextSize + xAxisLabelOffset,
        paint: paint);
}

// Draw Y axis labels
// The 1.5f * density on y is a hack to get the label aligned vertically.
// It will need adjustements if the font size changes.
paint.Reset();
paint.TextAlign = Paint.Align.Right;
paint.TextSize = labelTextSize;
paint.Color = lineColor;
for (int i = 0; i < horizontalSection.Count; i++)
{
    var y = plotBoundaries.Bottom - horizontalSection.Width * i;

    canvas.DrawText(
        text: (i * sectionHeight).ToString(),
        x: plotBoundaries.Left - yAxisLabelOffset,
        y: y - (paint.Ascent() / 2f + 1.5f * density),
        paint: paint);
}
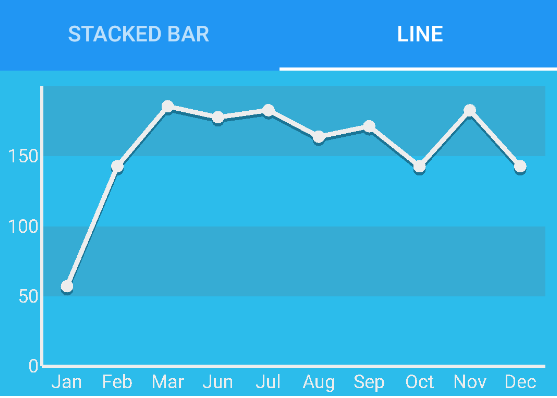
And here’s the result!
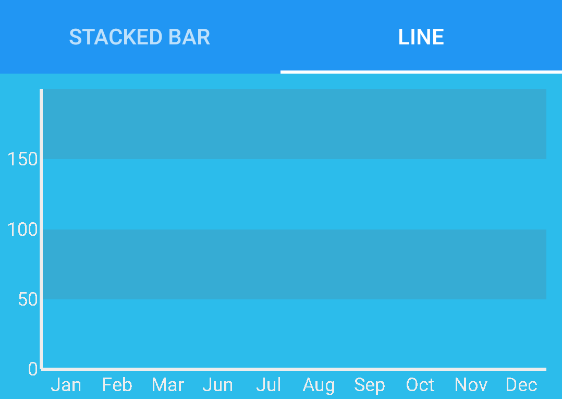
Woohoo nice!! Well done we got an empty plot now! That looks good to me. What’s missing? The line and markers of course!
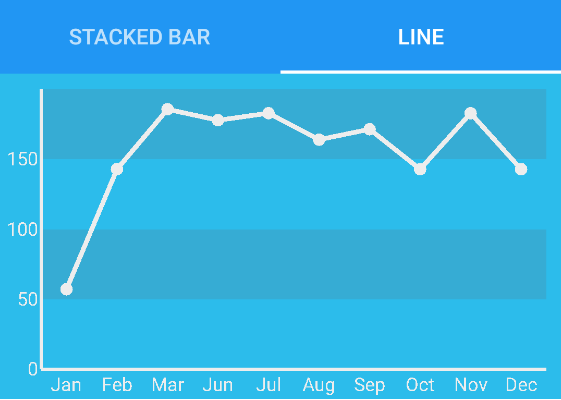
3. Draw lines and markers
In order to draw the lines, we simply iterate over all the points and link the points using canvas.DrawLine and at the intersection we draw the markers by using canvas.DrawCircle.
1
2
3
4
5
6
7
8
9
10
11
12
13
14
15
16
17
18
19
20
//// Draws main line
paint.Reset();
paint.StrokeWidth = lineStrokeWidth;
paint.Color = lineColor;
for (int i = 0; i < points.Count; i++)
{
    if (i < points.Count - 1)
        canvas.DrawLine(
            points[i].Item1,
            points[i].Item2,
            points[i + 1].Item1,
            points[i + 1].Item2,
            paint);

    canvas.DrawCircle(
        cx: points[i].Item1,
        cy: points[i].Item2,
        radius: markerDefaultRadius,
        paint: paint);
}
That looks good but because we are cool people, we will add some dimension to the line! So let’s add a shadow line behind it.
1
2
3
4
5
6
7
8
9
10
11
12
13
14
15
16
17
18
19
20
21
22
23
24
25
26
27
28
29
30
31
32
33
34
35
36
37
38
39
40
41
//// Draws line shadow
paint.Reset();
paint.StrokeWidth = lineStrokeWidth;
paint.Color = lineShadowColor;
for (int i = 0; i < points.Count; i++)
{
    if (i < points.Count - 1)
        canvas.DrawLine(
                points[i].Item1,
                points[i].Item2 + 2f * density,
                points[i + 1].Item1,
                points[i + 1].Item2 + 2f * density,
                paint);

    canvas.DrawCircle(
        cx: points[i].Item1,
        cy: points[i].Item2 + 2f * density,
        radius: markerDefaultRadius,
        paint: paint);
}

//// Draws main line
paint.Reset();
paint.StrokeWidth = lineStrokeWidth;
paint.Color = lineColor;
for (int i = 0; i < points.Count; i++)
{
    if (i < points.Count - 1)
        canvas.DrawLine(
            points[i].Item1,
            points[i].Item2,
            points[i + 1].Item1,
            points[i + 1].Item2,
            paint);

    canvas.DrawCircle(
        cx: points[i].Item1,
        cy: points[i].Item2,
        radius: markerDefaultRadius,
        paint: paint);
}
It’s basically the same code but with a small offset. And BOOM! We are done! Well done you created a line chart for your Xamarin.Android app.
I have added touch gesture handling in my example but have not describe it in the tutorial, if you are interested have a look at the code on my GitHub ;) https://github.com/Kimserey/GraphTest.Droid2/blob/master/Droid/GraphViewRenderer.cs.
Conclusion
Today we saw the PART 2 of how to draw a line chart for Xamarin.Android and Xamarin.Forms. We looked at a way to draw the layer of canvas one by one and saw how to compose the chart. I hope you enjoyed this small series and if you did let me know by leaving a comment or hit me on Twitter @Kimserey_Lam! See you next time!
Other post you will like!
- Build your own Line chart for Xamarin.Forms with Custom renderers (Part 1) - https://kimsereyblog.blogspot.co.uk/2016/10/build-your-own-line-chart-for.html
- What does DP, DPI, PPI and PX represent in Android - https://kimsereyblog.blogspot.co.uk/2016/10/what-does-dp-dpi-ppi-and-px-represent.html
- Make a splash screen in Xamarin.Android - https://kimsereyblog.blogspot.co.uk/2016/10/how-to-make-splash-screen-with.html
- Make an accordion view in Xamarin.Forms - https://kimsereyblog.blogspot.co.uk/2016/10/build-accordion-view-in-xamarinforms.html
- Absolute layout in Xamarin.Forms - https://kimsereyblog.blogspot.co.uk/2016/09/absolute-layout-and-relative-layout.html